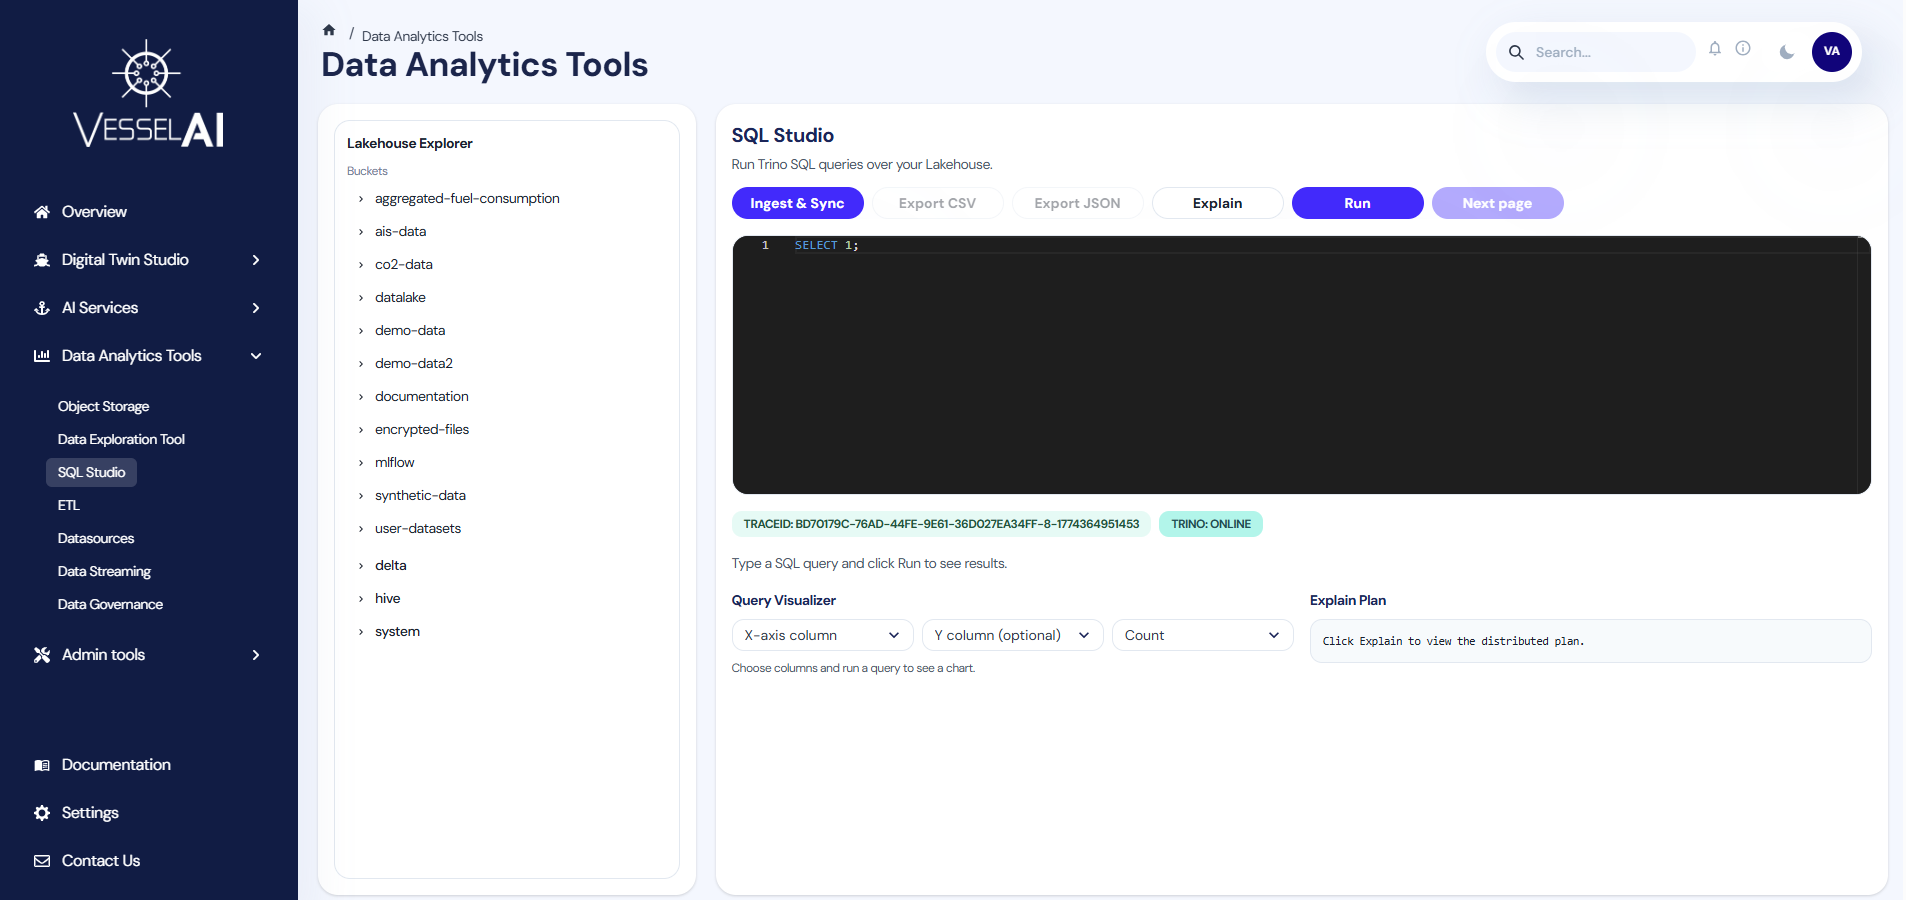
SQL Studio
Purpose
SQL Studio provides a direct SQL query interface for exploring and analyzing platform data using Trino.
Users can write SQL queries against the platform's Lakehouse, browse available schemas and tables, export results, and visualize query output — all without leaving the dashboard.
User Interface Overview
The SQL Studio page is organized into two main panels:
- Lakehouse Explorer (left panel) — Schema and table browser
- Query Editor (right panel) — SQL editor with action toolbar, results table, and visualization
Lakehouse Explorer
The left panel displays the available data catalog:
- Browse catalogs, schemas, and tables
- View column names and data types
- Click on a table to auto-insert a
SELECTquery snippet into the editor
This helps users discover available datasets without memorizing table names.
The explorer refreshes automatically after syncing or ingesting new tables.
Query Editor
The main panel contains:
- Action Toolbar — Buttons for data ingestion, syncing, exporting, and query execution
- SQL Input — A code editor for writing SQL queries
- Status Badges — Live query ID, trace ID, and Trino connection status indicators
- Results Table — Paginated output of query results
- Query Visualizer — Interactive bar chart based on query output
- Explain Plan — Distributed execution plan display
Action Toolbar
The toolbar provides the following actions:
| Action | Description |
|---|---|
| Ingest & Sync | Scans Object Storage for raw files (CSV, Parquet, JSON), converts them to Delta Lake format, and registers them in the Trino catalog — a single-click data pipeline |
| Export CSV | Download query results as a CSV file |
| Export JSON | Download query results as a JSON file |
| Explain | Show the distributed execution plan for the current query |
| Run | Execute the current SQL query |
| Next Page | Load the next page of results (for large result sets with paginated output) |
| Cancel | Cancel a currently running query |
A Dagster sensor also runs this pipeline automatically every 30 seconds in the background, so new files uploaded to Object Storage are detected and converted without manual intervention.
Status Badges
After executing a query, the toolbar displays:
| Badge | Description |
|---|---|
| queryId | The unique Trino query identifier for the current execution |
| traceId | The distributed trace ID for debugging |
| Trino: online | Indicates the Trino cluster is reachable (hover to see the node version) |
| Trino: unreachable | Indicates the Trino cluster cannot be reached |
What Users Can Do
Run SQL Queries
- Type a SQL query in the editor
- Click Run
- Results appear in the paginated table below
Queries run against Trino, which connects to the platform's data catalog including Delta Lake tables, Parquet files, and CSV datasets stored in Object Storage.
For large result sets, Trino returns data in pages. Click Next Page to load additional batches. Use Cancel to stop a long-running query.
Browse the Lakehouse
Use the Lakehouse Explorer on the left to:
- Navigate through catalogs and schemas
- View table structures and column types
- Click a table name to generate a sample query
Ingest & Sync New Data
The Ingest & Sync button provides a one-click pipeline for making raw data queryable:
- Click Ingest & Sync
- The platform scans Object Storage for raw files (CSV, Parquet)
- Files are automatically converted to Delta Lake format
- Resulting Delta tables are registered in the Trino catalog
- The Lakehouse Explorer refreshes to show the new tables
A toast notification reports the number of files scanned, converted, and any errors encountered.
Export Results
After running a query:
- Click Export CSV to download results as a comma-separated file
- Click Export JSON to download results as a JSON array
Visualize Results
SQL Studio includes a built-in bar chart visualizer:
- Run a query that returns data
- Select the X-axis column from the dropdown
- Optionally select a Y-axis column
- Choose an aggregation mode (Count or Sum)
- The chart renders automatically
This provides immediate graphical insight without external tools.
Explain Queries
Click Explain to view the distributed execution plan. This shows how Trino will process the query, including splits, stages, and data movement between nodes. The plan is displayed in a monospace panel alongside the chart visualizer.
Query Examples
List all tables
SHOW TABLES FROM delta.default;
Query a Delta table
SELECT * FROM delta.bucket_name.file_name LIMIT 100;
Official Reference
- Trino documentation: https://trino.io/docs/current/