ETL
Purpose
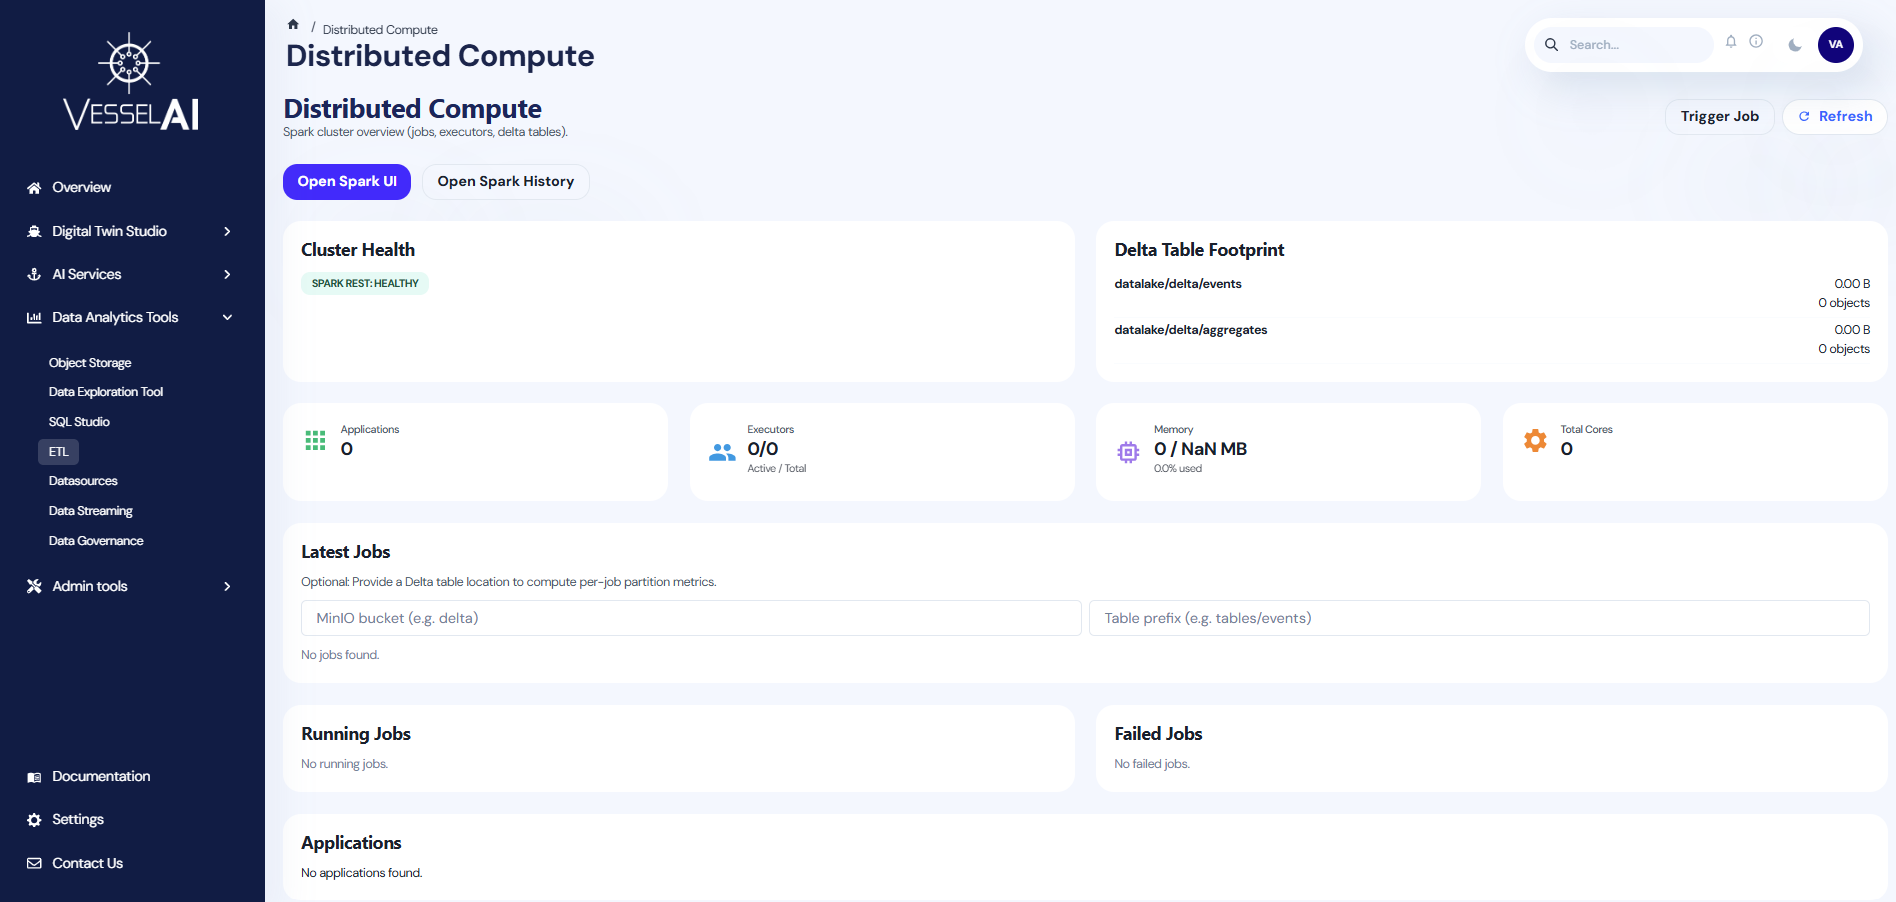
The ETL page provides monitoring and control over the platform's distributed data processing infrastructure, powered by Apache Spark.
ETL (Extract, Transform, Load) is the process that prepares raw data for downstream analysis. This page helps users oversee data transformation jobs, monitor cluster health, and manage Delta table storage.
User Interface Overview
The ETL page is organized into the following sections:
- Header Bar — Page title with Trigger Job, Refresh, and Spark UI buttons
- Cluster Health & Delta Tables — Side-by-side cards showing cluster status and Delta table footprint
- Key Metrics — Summary cards for applications, executors, memory, and cluster settings
- Job Tables — Running jobs, latest jobs, and failed jobs
Header Actions
The top bar provides:
- Trigger Job — Submit a new Spark job to the cluster by specifying the application resource, main class, arguments, and job name
- Open Spark UI — Opens the Spark Web UI in a new tab (via OAuth2 proxy) to monitor active jobs and execution load
- Open Spark History — Opens the Spark History Server to review completed jobs, compare past runs, and analyze historical patterns
- Refresh — Reloads cluster data and checks Spark REST API health
Cluster Health
Displays the current health of the Spark cluster:
- Spark REST Status — Shows whether the Spark REST API is healthy or down
- Health checks run automatically on page load
Delta Table Footprint
Lists all configured Delta tables with:
- Path — Storage location of the Delta table
- Size — Total storage size
- Object Count — Number of objects in the table
- Errors — Any configuration or access issues
Key Metrics
Four summary cards provide an overview of cluster resources:
| Metric | Description |
|---|---|
| Applications | Number of Spark applications registered |
| Executors | Active vs total executors (e.g., 2/4) |
| Memory | Total memory allocated across executors |
| Cluster Settings | Core configuration (cores per executor, etc.) |
Job Tables
Three sections track job execution:
- Running Jobs — Currently executing Spark jobs with real-time status
- Latest Jobs — Recently completed jobs with duration and result
- Failed Jobs — Jobs that encountered errors, with error details
Each job row shows the application ID, job ID, job name, submission time, duration, and status. Users can click Inspect to open a metrics drawer showing detailed execution breakdown.
Job Metrics
When inspecting a job, the metrics drawer displays:
- Stage breakdown — Number of stages, tasks, and shuffled data
- Input/Output metrics — Bytes read and written
- Partition metrics — Optional Delta table context for per-job partition analysis
Users can configure a target bucket and prefix to correlate Delta table activity with specific jobs.
What Users Can Do
- Monitor Spark cluster health and resource utilization
- Track running, completed, and failed ETL jobs
- Submit new Spark jobs directly from the dashboard
- Inspect job-level metrics and stage breakdowns
- View Delta table storage footprint and health
- Open Spark UI and History UI for detailed investigation
Official Reference
- Apache Spark documentation: https://spark.apache.org/docs/latest/