Data Exploration Tool
Purpose
The Data Exploration Tool is a visual query builder that lets you explore and analyse the datasets available on the VesselAI platform.
It allows users to select variables, apply filters, run queries, and view results — all without writing SQL.
This tool allows users to:
- Explore available datasets and select specific variables
- Apply value, spatial, and time-based filters
- Run queries and view results in a paginated table
- Save and reload queries for repeated analysis
- Combine variables from up to two datasets in a single query
- Group, sort, and set resolution for aggregated results
- Register new datasets from MinIO storage via the Dataset Manager
Navigate to:
Data Analytics Tools → Data Exploration Tool
The page has two main views, toggled by the tabs at the top:
- Overview — The visual query builder (described below)
- Dataset Manager — Register, browse, and manage datasets for the query builder
Dataset Manager
The Dataset Manager lets administrators register datasets from the platform's MinIO object storage so they become available for querying in the Data Exploration Tool.
It has three sub-tabs:
MinIO Browser
Browse the contents of all MinIO buckets directly from the dashboard.
- Click a bucket to expand it and see its files
- Click a CSV, JSON, or Parquet file to select it for registration
- The selected file is passed to the Upload & Register tab for schema preview
Upload & Register
This tab handles both uploading new files and registering datasets.
1. Upload File to MinIO
- Drag & drop a file or click to browse
- Supported formats: CSV, Parquet, JSON
- Files are uploaded to the
user-datasetsbucket
2. Register Dataset
After selecting or uploading a file, the schema is detected automatically and the available columns are shown.
For each detected column, you can configure:
- Name — The column name (matches the source file)
- Title — A human-readable display name
- Type — Data type (INTEGER, FLOAT, VARCHAR, BOOLEAN)
- Role — Either Variable (a measurable value) or Dimension (a grouping/filtering key)
- Unit — The unit of measurement (e.g., m/s, °C)
Fill in the Dataset Title and optionally a Description, then click Register Dataset. The dataset will become available in the query builder's Select Data dialog.
Registered Datasets
View and manage all datasets currently registered in the Data Exploration Tool.
For each dataset, the table shows:
- Title — The dataset name
- Storage — The storage backend (e.g.,
VESSELAI_TRINO,VESSELAI_POSTGRES) - Publisher — The data publisher (defaults to
VesselAI) - Variables — Number of registered variables
- Actions — Delete button to remove the dataset registration
Deleting a dataset from Registered Datasets only removes it from the query builder. The underlying data in MinIO and Delta Lake is not affected.
Automated Ingestion
The platform includes a Dagster sensor that automatically scans MinIO for new files every 30 seconds. When a new CSV, Parquet, or JSON file is detected:
- It is converted to Delta Lake format
- The Delta table is registered in Trino
- The table becomes queryable in SQL Studio immediately
To make the dataset available in the Data Exploration Tool, it must also be registered via the Dataset Manager (which maps columns to variables and dimensions for the visual query builder).
User Interface Overview
The Data Exploration Tool page is structured into three main sections:
- Toolbar (top section)
- Left Panel with Variables, Filters, and Operations tabs
- Main Area with data results table
Toolbar
The toolbar sits at the top of the page and provides the following interaction options.
- New
Clears the current query and starts fresh.
- Open
Loads a previously saved query.
- Save
Saves the current query (prompts for a name).
- Save As
Saves a copy of the current query under a new name.
- Select Data (green button)
Opens the dataset browser to choose which data to query.
- Limit
Controls how many rows are returned (100, 500, 1,000, or 10,000).
- Run (red button)
Executes the current query and shows results.
Selecting Data
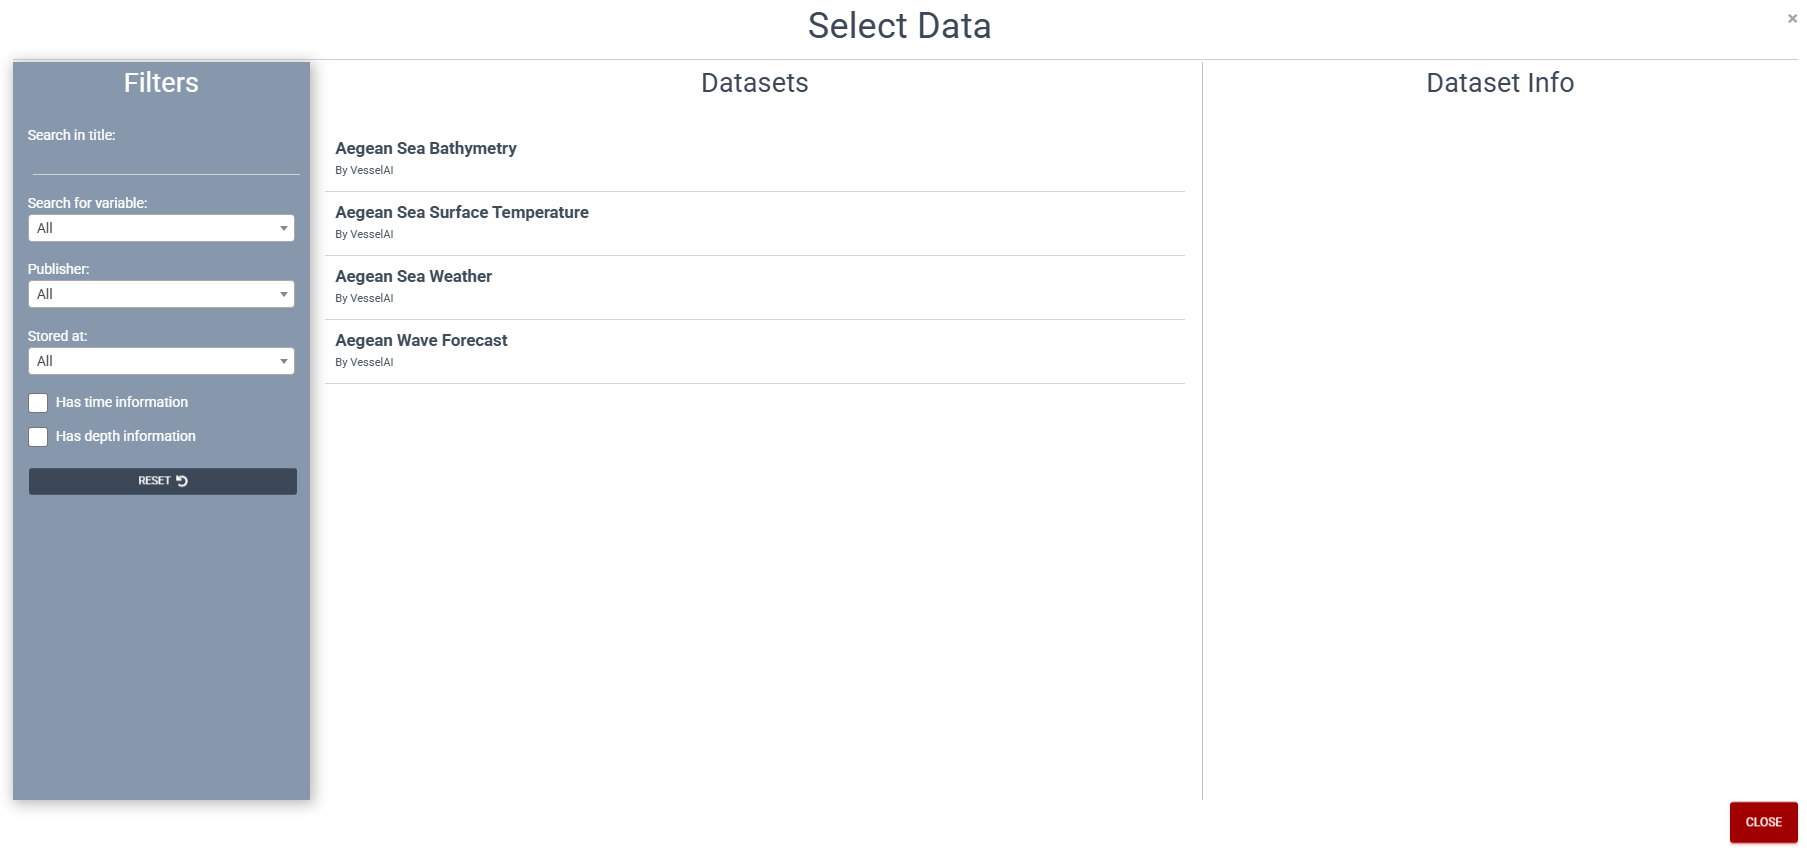
Click the Select data button to open the Select Data modal.
The modal is divided into three areas:
- Filters (left sidebar) — Narrow down the list of available datasets
- Datasets (centre) — Browse and select a dataset
- Dataset Info (right panel) — View details about the selected dataset
Filters
The Filters sidebar lets you refine which datasets appear in the Datasets list.
- Search in title — Free-text search — type part of a dataset name to filter the list
- Search for variable — Dropdown listing all available variables (e.g., Pressure at Sea Level, Air Temperature, Chlorophyll Concentration, Depth, Relative Humidity). Select one to show only datasets that contain that variable
- Publisher — Dropdown to filter by data publisher (e.g., VesselAI)
- Stored at — Dropdown to filter by storage backend (e.g., VESSELAI_POSTGRES)
- Has time information — Checkbox — show only datasets that include a time dimension
- Has depth information — Checkbox — show only datasets that include a depth dimension
- RESET — Clears all filters and returns the list to its default state
Choosing a Dataset and Adding Variables
- Browse the Datasets list — Each entry shows the dataset name and its publisher (e.g., Aegean Sea Bathymetry — By VesselAI)
- Click a dataset — The Dataset Info panel on the right displays the dataset's details and its available dimensions
- Expand dimensions — Click on a dimension to reveal the individual variables it contains
- Add variables — Click on the variables you want to include in your query; selected variables are highlighted
- Combine datasets — You can select variables from up to two different datasets in a single query (they will be joined automatically)
- Click Close when you are done
After selecting your data, the Variables, Filters, and Operations tabs in the left panel become active.
Left Panel Tabs
Variables
Shows the selected variables (columns) that will appear in your query results.
These are populated after you use Select data.
If you selected variables from two datasets, a joined dimensions area shows how the datasets are linked.
Filters
Click Data filters to open the filter editor, where you can:
- Add value filters — e.g., speed > 10, fuel_type = "HFO"
- Add spatial filters — Draw a rectangle on the Leaflet map to filter by geographic area (latitude/longitude bounds)
- Add time filters — Set date/time ranges for temporal data
- Combine filters with AND / OR logic
The filter counter (e.g., "Data filters (2)") shows how many active filters are applied.
Operations
Configure additional query operations:
- Group — Group results by one or more variables (like SQL
GROUP BY) - Sort — Order results by one or more variables (ascending or descending)
- Resolution — Set the temporal or spatial resolution for aggregated queries
Running a Query
- Click Select data and choose your variables
- (Optional) Apply Filters and Operations
- Set the Limit (default: 100 rows)
- Click Run
Results appear in the Data table in the main area. Use the Previous / Next buttons below the table to paginate through large result sets.
Saving and Loading Queries
Saving
- Click Save in the toolbar
- Enter a name for your query in the dialog
- Click Save to store it
Use Save As to create a copy under a different name (useful for creating variations of an existing query).
Loading
- Click Open in the toolbar
- A list of your previously saved queries appears
- Click a query to load it — all variables, filters, and settings are restored
Queries are saved per user. You can only see and load your own queries.
Authentication
The tool uses Keycloak SSO for authentication.
If you are not logged in, a Login button appears in the top-right corner. Click it to authenticate through Keycloak.
Once logged in, your username is displayed and you can Logout at any time.
You must be logged in to save, load, or delete queries.
Example Scenario — Querying Voyage Data
This example walks you through a simple query to explore vessel voyage data.
Step 1 — Select Data
- Click the Select data button
- In the dataset browser, find a voyage dataset (e.g., voyage emissions data)
- Select the variables you want to explore, such as:
- Vessel name
- Speed
- CO₂ emissions
- Timestamp
- Click OK to confirm your selection
Step 2 — Apply a Filter (Optional)
- Go to the Filters tab and click Data filters
- For example, add a filter:
speed > 10to only include voyage segments where the vessel was moving
Step 3 — Set the Limit
- In the top-right corner, set the Limit to
500to see more rows
Step 4 — Run the Query
- Click the Run button
- The results table populates with your data
- Use Previous / Next to browse through the results
Step 5 — Save Your Query
- Click Save, give it a name like
"Voyage CO2 Analysis", and click Save - You can reload it anytime by clicking Open