AI Workflows
Purpose
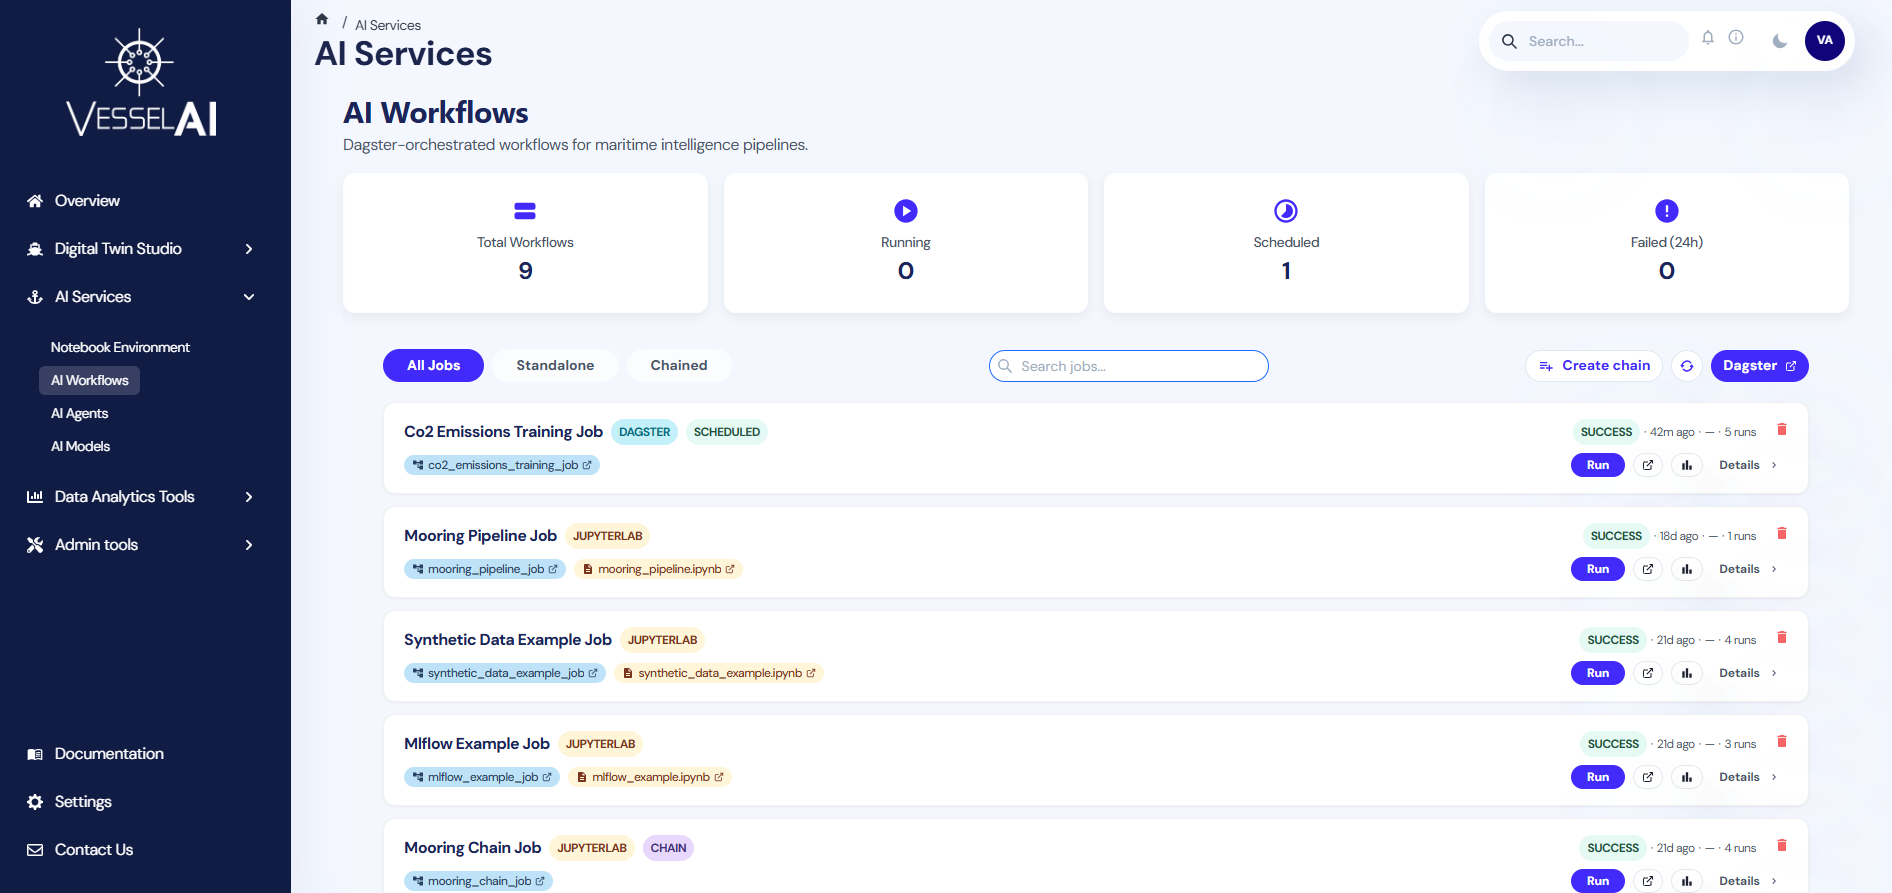
The AI Workflows page is the central hub for monitoring and managing all Dagster-orchestrated pipelines on the VesselAI platform.
It provides a real-time overview of job statuses, execution history, and results — all from a single dashboard.
This page allows users to:
- Monitor all registered workflows and their statuses
- Launch job executions directly from the dashboard
- View execution results, metrics, plots, and output tables
- Create chain jobs by linking multiple jobs in sequence
- Filter and search across all registered workflows
- Access external tools such as Dagster and MLflow
Navigate to:
AI Services → AI Workflows
User Interface Overview
The AI Workflows page is structured into two main sections:
- KPI Dashboard (top section)
- Workflow Cards (bottom section)
KPI Dashboard
The top panel displays four real-time summary cards that auto-refresh every 30 seconds.
- Total Workflows
Total number of registered jobs (excludes internal Dagster asset jobs).
- Running
Jobs currently in progress (status: STARTED, STARTING, QUEUED, MANAGED, or CANCELING).
- Scheduled
Jobs with an active Dagster schedule.
- Failed (24h)
Jobs that failed in the last 24 hours.
Toolbar
Below the KPI cards, a toolbar provides three primary interaction options.
- Create Chain Job
Enters selection mode to combine multiple jobs into a sequential chain.
- Refresh
Manually reloads the job list from Dagster.
- Open Dagster
Opens the Dagster activity timeline in a new browser tab.
Filtering and Searching
The page provides filtering and search capabilities for quick access to specific workflows.
Filter Tabs
Four tabs let you filter by job type:
- All Jobs — Shows every registered workflow
- Native — Only native Dagster jobs (not part of a chain)
- Notebook — Only JupyterLab notebook-based jobs (not part of a chain)
- Chained — Only chain jobs (multiple jobs linked together)
Search
A search bar with autocomplete helps you find specific jobs.
Type at least 2 characters to see suggestions.
The search matches against:
- Job title
- Internal job name
- Prefix
Workflow Cards
Each job appears as a card displaying the following information.
Header
- Job title — Human-readable name derived from the internal Dagster job name
- Type badge — One of:
Jupyterlab(orange) — Job created by linking a notebookDagster(cyan) — Native Dagster jobScheduled(green) — Job with a defined schedule
- Chain badge (purple) — Shown if the job is a chain of multiple jobs
- Scheduled badge (green) — Shown if the job has an active schedule
Metadata Row
Each card displays real-time metadata:
- Status — Latest run status (SUCCESS, FAILURE, STARTED, etc.) with a color-coded badge
- Last Run — Time elapsed since the last execution (e.g., "2h ago")
- Next Run — Time until the next scheduled execution, or "—" if unscheduled
- Executions — Total number of recorded executions
Job & Notebook Links
- Showing job: A clickable blue pill showing the internal Dagster job name. Click to open the job in Dagster.
- Linked notebook: (Only for notebook-based jobs) An orange pill showing the notebook filename. Click to open it in JupyterLab.
Action Buttons
Each workflow card provides the following actions:
- Run Now
Always available. Opens the Dagster Playground for the job (notebook jobs) or the job page (native jobs).
- View Last Run
Available after at least one run. Opens the last run's details in Dagster.
- View in MLflow
Available after at least one run. Opens the corresponding MLflow experiment.
- View Results
Available after at least one run. Opens a results modal within the dashboard.
- View Details
Always available. Expands to show job origin and execution mode details.
Delete Button
A small red bin icon in the top-right corner of each card allows you to delete the job.
A confirmation dialog prevents accidental deletions.
View Details — Job Origin
Clicking View details on a card reveals additional information.
For Notebook Jobs (JupyterLab)
- Origin: "JupyterLab Notebook" badge
- Execution Mode: One of:
- Observational — The notebook runs top-to-bottom as a single Dagster op via Papermill
- Pipeline — The notebook defines
# %% step:directives, each running as a separate Dagster op
For Chain Jobs
- Chain Job Components: A visual pipeline showing each step in sequence (Step 1 → Step 2 → Step 3 → …)
For Dagster Native Jobs
- Origin: "Dagster Native" badge — A native Dagster job defined directly in pipeline code
Viewing Job Results
Click View Results on any card that has completed at least one run to open the results modal.
The modal displays:
- Execution summary — Status, duration, and timestamps
- Metrics — Key-value pairs logged during execution (e.g., MAE, R², accuracy)
- Output tables — CSV data produced by the job, displayed in a scrollable table
- Plots — Any charts or visualizations generated during execution
- Step details (Pipeline & Chain jobs) — Per-step breakdown with individual metrics and artifacts
Creating a Chain Job
A chain job links multiple existing jobs into a sequential pipeline.
To create one:
- Click Create chain job in the toolbar
- The page enters selection mode — cards become clickable
- Click jobs in execution order (first to last). Each selected card shows a numbered badge (1, 2, 3…)
- Select at least 2 jobs (the Create Chain button is disabled with fewer)
- Click Create Chain in the toolbar
- In the dialog, enter a name for the chain (e.g.,
Mooring Full Pipeline) - Click Create to register the chain in Dagster
- The new chain job appears in the workflow list with a
Chainbadge
Click Cancel at any time to exit selection mode without creating a chain.
Opening External Tools
Several actions open external tools in a new browser tab:
- Click the job pill (blue) → Dagster job page
- Click the notebook pill (orange) → JupyterLab with the notebook
- Click Run Now → Dagster Playground for the job
- Click View Last Run → Dagster run details for the latest execution
- Click View in MLflow → MLflow experiment page
- Click Open Dagster (toolbar) → Dagster activity timeline
Auto-Refresh
The page automatically refreshes data every 30 seconds, keeping the KPI cards and workflow statuses up to date.
Click Refresh for an immediate update.
Quick Reference
Job Type Decision Tree
Was the job created from a linked notebook?
  ├── YES → Type = Jupyterlab
  │          Does it have # %% step: directives?
  │            ├── YES → Execution Mode = Pipeline
  │            └── NO  → Execution Mode = Observational
  └── NO  → Is it defined natively in Dagster?
              ├── YES → Type = Dagster
              └── NO  → Was it created with "Create chain job"?
                          └── YES → Type = Chain
Keyboard Shortcuts (Search)
↓/↑— Navigate search suggestionsEnter— Select highlighted suggestionEsc— Close suggestions dropdown
Example Scenario — Running the CO₂ Emissions Training Job
This example walks you through running the built-in CO₂ emissions model training pipeline.
Step 1 — Open the Job
-
Navigate to:
AI Services → AI Workflows
-
Find the CO₂ Emissions Training card
-
Click Run Now
This opens the Dagster job page where you can see the three pipeline assets: input_data → trained_model → evaluated_pipeline.
Step 2 — Launch the Configuration
- Click the Materialize all button in the top-right corner
This opens the Launchpad configuration editor.
Step 3 — Configure the Run
When you click Materialize all, the Launchpad pre-fills the following configuration:
ops:
  co2__train__evaluated_pipeline:
    config:
      co2_model_name: co2_rfr
  co2__train__input_data:
    config:
      bucket: co2-data
      filename: bulk-cleaned-voyage-data.csv
  co2__train__trained_model:
    config:
      model:
        mlp:
          activation: relu
          alpha: 0.001
          hidden_layer_sizes:
            - 100
            - 50
          max_iter: 1000
          solver: adam
        rfr:
          n_estimators: 100
⚠️ Important: You must keep only one model block — either
mlporrfr. Comment out (prefix lines with#) or delete the block you don't want to use. If you leave both, Dagster will show an error: "You can only specify a single field at path (…config.model)".
Step 4 — Customize (Optional)
You can optionally adjust the following fields:
co2_model_name— Name for the trained model in MLflow (e.g.,co2_rfr,co2_mlp_v2)bucket— MinIO bucket containing your training data (e.g.,co2-data)filename— CSV file with voyage data (e.g.,bulk-cleaned-voyage-data.csv)
Step 5 — Launch
Click Materialize to start the run. The pipeline will:
- Load data from MinIO (
co2_train_input_data) - Train the model with your chosen algorithm (
co2_train_trained_model) - Evaluate performance and log metrics to MLflow (
co2_train_evaluated_pipeline)
Step 6 — View Results
Once complete, return to the AI Workflows page and click View Results on the card to see metrics (MAE, R², etc.) and plots, or click View in MLflow to inspect the full experiment.